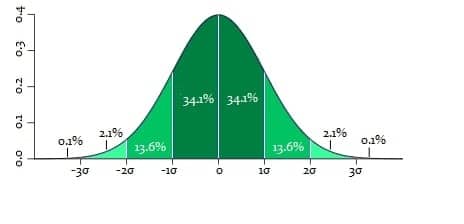
How many times have we been disappointed with a grade during our schooling or simply thought how unfair the grading threshold was? Have we ever wondered whether there exists a “normal” and realistic distribution of scores on exams? Some of us who are enthusiasts of graph theory may have also asked ourselves which curve would best illustrate the coefficients of intelligence of randomly selected people, or the frequency by month of a disease that has no seasonal variation. This blog brings us answers to these reflections and questions, with the central concept hidden in them being the Gaussian curve.
The Gaussian, Laplace–Gauss, or normal distribution is the probability distribution of a continuous variable that holds a significant place in probability theory and in statistics itself. If we dive into the historical development of the definition of the normal distribution, or Gaussian curve, we may come across historical sources that attribute the discovery to mathematician Abraham De Moivre. This is, from one perspective, true: he formulated it as the limiting form of the binomial distribution in his book The Doctrine of Chances published in 1738. However, from another perspective, De Moivre’s interpretation and definition were somewhat vague and insufficient. According to Stigler, De Moivre interpreted his results almost equivalently to an approximate rule for binomial coefficients, lacking the concept of the probability density function itself.
Thanks to the German mathematician C. F. Gauss, we know the normal distribution in its full scope with the definition of the curve itself. In 1823, Gauss published Theoria combinationum erroribus minimis obnoxiae, in which he established postulates fundamental to statistical fields such as the method of least squares, the method of maximum likelihood, and the normal distribution itself. Contributions to defining the normal law of distribution were also made by the French scientist Pierre-Simon Laplace, though his work took him in a slightly different direction, leading to the Laplace distribution. On the other hand, the Irish mathematician Adrian, independently of Gauss, simultaneously derived two versions of the normal law of probability. Unfortunately, he became just another among those scientists whose contemporaries, at that time, had little appreciation for their discoveries. What sets Gauss apart from De Moivre and Adrian is the clearest and most compact concept of the probability density function. As is often the case when multiple scientists converge on the same concept, the greatest challenge becomes the naming of the discovery.
Since its introduction, the normal distribution has been known under many different names: the law of error, the law of possibility of errors, Laplace’s second law, Gauss’s law, etc. However, by the late 19th century, some authors began using the term “normal distribution,” with the word normal used as an adjective—an expression now understood to reflect the fact that this distribution was considered typical, common, and therefore “normal.”
Applications are significant in biostatistics, such as calculating body weights for a particular gender and age group, intelligence quotients expressed as percentages of a given population, and, ultimately, the grade distribution of a group of students. For example, from the total number of students who passed the minimum threshold, a distribution can be created so that 15% of the students with the highest scores receive the grade excellent, the next 34% very good, the following 34% good, and the remaining 15% sufficient (which can clearly be seen in the graphical representation in the introduction). As in everything, there are deviations from the normal distribution, either partial or complete, such as positively skewed distributions of cholesterol concentration in the adult U.S. population, negatively skewed pregnancy durations, bimodal hormone concentrations in men and women, and many other examples.
We hope this blog has answered some of your questions and shown a more engaging side of statistics. Should you need help in tackling similar topics, drawing graphs, or with any branch of mathematics, feel free to reach out to us for online instrukcije and problem-solving. eMatematika.hr
