
How do you measure the diagnostic ability of binary classifiers? Two popular methods are AUC ROC and Log Loss. The first assessment system, which is based on a curve, is now found in many industries from medicine to natural hazards to machine learning. Here are the basics of creating and interpreting this graph.
The combination of Area Under the Curve (AUC) and Receiver Operator Characteristic (ROC) is a reasonable choice for many tasks involving two classes. At the same time, it has limitations, such as insensitivity to meaningful misorderings. Dasha.AI expert provides info about AUC formula calculating for machine learning application. In this article, we will only consider the fundamentals.

What is the AUC – ROC Curve?
In machine learning, the assessment of accuracy is vital. When professionals tackle a classification problem involving different classes, they can use AUC to check or visualize performance. This metric is one of the crucial ways to check success, and it allows different threshold settings.
How capable is your ML model of distinguishing between classes? The higher the AUC (a measure of separability), the better it is at predicting 1 class as 1 and 0 as 0. For example, models with high AUC can successfully predict if your customer will choose jeans over suede pants or if your email will be classified as spam.
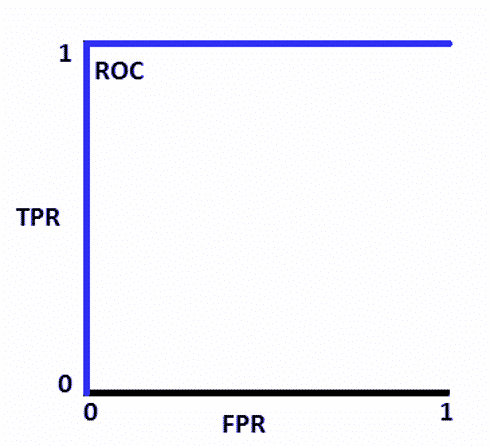
ROC is a probability curve. On the y-axis, you can see TPR, while the x-axis shows FPR:
- TPR, or True positive rate, expresses the share of correct positive results among all positive samples used in the test.
- FPR, or False Positive Rate, reflects the share of negative events mistakenly categorized as positive. The ideal ROC graph looks this way:
How to Speculate About the Performance of the Model?
A model with an excellent prediction scale will have AUC close to 1. This shows a reliable measure of separability. In comparison, zero is the worst possible measure meaning that the result is reciprocated. 0s are predicted as 1s, and vice versa. 0.5 means that your model is not able to separate classes at all.
To see how this works in practice, consider the following graph, which shows the curve with distributions of “spam” and “not spam” probabilities for an email. The former is marked with a pale purple, while the latter is dark.
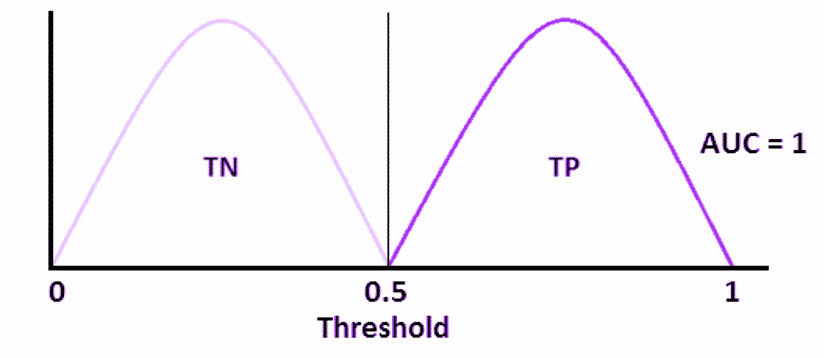
If you plot the same distributions on the ROC curve, you will get the ideal graph that is shown above, where FPR is always 0, while TPR is always 1. If the curves overlap, the measure of separability would not be ideal. This would mean your system is not always able to separate positive classes from negative ones accurately.
As we have already mentioned, an AUC of 0.5 shows an inability to distinguish between the said classes. If it is 0, the model always gives the wrong answer. So, what if it is 0.7? This means the probability of correct classification is 70%.
By decreasing the threshold, you will raise your system’s sensitivity. At the same time, its specificity will move in the opposite direction, and you will get more positive values. Raising the threshold brings the opposite results. Note that the AUC ROC method can also be used for three or more classes.
What Is Log Loss?
This second method of assessing prediction skills in ML is based on a formula instead of a graph. It measures accuracy based on the concept of probabilistic confidence. The calculation considers the uncertainty of a prediction based on its divergence from the label. Log loss may also be used for two or more records.
Here is how it could work for the same example with spam and non-spam emails. Suppose you want to understand if your messages are likely to be delivered to the junk folder instead of the inbox. In this case, you have a binary choice between these true values: 1 (spam) and 0 (inbox). The formula includes the true value and the probability of prediction for the natural logarithm.
Based on the result, you can see how well the model works for a particular instance, and the average of outputs for all instances describes the model in general. For example, 0.1 probability means that your email is most likely to be identified as a genuine message. 0.9 indicates the opposite result. Log loss measures the divergence between the probability and the value. The lower it is, the more accurate your model.
Which Is Better — Log Loss or AUC ROC?
Choosing the right metric for evaluating machine learning models is crucial. Generally, log loss is preferable if you are focused on the absolute probabilistic difference. However, if you need the final class prediction without adjusting the threshold, stick to the AUC. This method is also preferable if you are focused on a class that is smaller regardless of being positive or negative.
On the other hand, AUC ROC may disappoint you in case of imbalanced data. It may show values reaching 1 despite poor performance in identifying cases. Therefore, double-check the precision and recall.
In case of log loss, imbalanced data may cause a different problem. If your model predicts class 0 with 99% probability, but the actual class is 1, the loss can become infinite. This means your algorithm will be spoiled.
Final Thoughts
AUC ROC is an important metric for measuring the performance in classification models. It can tell you about the capability of your system in terms of distinguishing between different classes. The higher the AUC value, the better the accuracy. These curves are often used to visualize the trade-off between sensitivity and specificity at various threshold settings. In comparison with log loss, AUC ROC has both strengths and weaknesses.