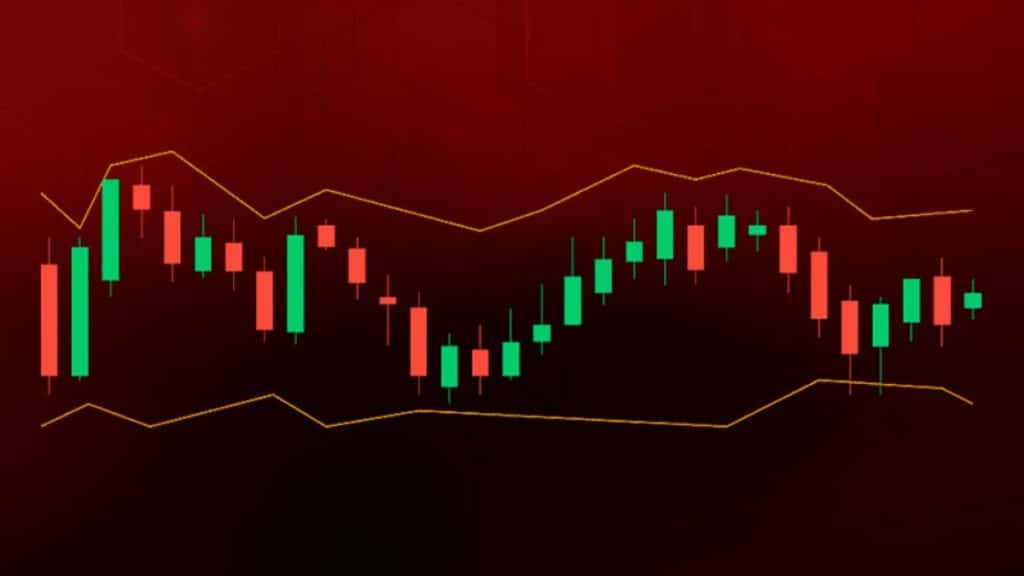
Bollinger Bands are a powerful tool for spotting overbought market conditions. By tracking a stock’s price movements against its average, these bands can signal when a stock is trading at extreme levels. Traders use this insight to make savvy buy and sell decisions, enhancing their strategies and reducing risks. Let’s dive into how Bollinger Bands help us navigate these market signals. Go bitindexai.top/ to learn in depth about option trading and make informed decisions with premium education under your belt.
The Role of the Upper Band in Signaling Overbought Markets
The upper band of Bollinger Bands is a key indicator when it comes to spotting overbought conditions. When a stock’s price touches or surpasses the upper band, it’s a sign that the stock might be overbought.
This happens because the upper band is set at a certain number of standard deviations above the moving average, capturing price movements that are significantly higher than usual.
Think of the upper band as a warning light. When prices hover around it, it suggests that the market might be heating up too much, too quickly. Traders often watch for these signals to decide if it’s time to sell or hold off on buying.
For instance, if Apple’s stock price reaches the upper band, many traders might interpret it as a signal that Apple is currently overpriced, leading to potential sell-offs.
Have you ever noticed how people react when a popular gadget is in limited supply? Prices surge, but that doesn’t last forever. Similarly, stocks touching the upper band might just be peaking before a pullback. It’s important to remember, though, that while the upper band is useful, it’s not foolproof. Always combine it with other indicators to make more informed decisions.
Statistical Basis: Standard Deviations and Mean Reversion
Bollinger Bands rely heavily on statistical concepts like standard deviations and mean reversion. Standard deviation measures how spread out numbers are in a data set. In the context of Bollinger Bands, it helps set the boundaries for the bands around the moving average.
Imagine you’re tossing a bunch of coins. Most will land around the center, but some will fall far from it. The more coins you toss, the more you understand the spread. Similarly, stock prices usually hover around their average but can sometimes stray far. Bollinger Bands use standard deviations to capture these movements, with the upper and lower bands marking these extremes.
Mean reversion, on the other hand, is the idea that prices will tend to move back towards the average over time. So, if a stock price is significantly above the moving average (touching the upper band), it’s likely to revert back to the mean. This tendency helps traders predict potential price corrections.
Imagine you’re walking a dog on a leash. The dog can stray left or right, but it always comes back to the center. Stock prices behave similarly, fluctuating but generally returning to their average. This concept is vital for traders looking to capitalize on price extremes.
Enhanced Accuracy with Volume Confirmation
Combining Bollinger Bands with volume analysis can greatly enhance trading accuracy. Volume represents the number of shares traded and can validate the signals given by Bollinger Bands. When the price touches the upper band with high volume, it’s a stronger indication of an overbought condition.
For instance, if a stock hits the upper band and you also notice a spike in trading volume, it’s a double confirmation. High volume means more traders are involved, adding weight to the signal. It’s like having a second opinion. If you’re planning a trip and multiple weather forecasts predict rain, you’re more likely to pack an umbrella.
Conversely, if the price touches the upper band but the volume is low, the overbought signal might be weaker. It’s like a half-hearted cheer at a sports game; it doesn’t carry as much weight. Volume confirmation helps in making more confident trading decisions.
Next time you analyze a stock, don’t just look at the price. Check the volume too. It can be the difference between a strong signal and a false alarm.
Case Studies Demonstrating Volume and Bollinger Band Correlation
Let’s dive into some real-world examples to see how Bollinger Bands and volume correlation work. One notable case is Tesla’s stock movements in 2020. When Tesla’s price touched the upper Bollinger Band, traders also noticed significant spikes in trading volume. This alignment often led to price corrections shortly after, confirming overbought conditions.
Another example is the tech boom of the late 1990s. Many tech stocks showed similar patterns. Prices would hit the upper band, accompanied by massive trading volumes. Savvy traders who noticed this correlation managed to sell before the bubble burst, saving themselves from significant losses.
Imagine you’re at an auction, and suddenly, everyone starts bidding aggressively. If you see this happening, you might think prices are going too high too fast. Similarly, in stock trading, when prices hit the upper band and volume surges, it’s often a sign that the stock is overbought.
Conclusion
Bollinger Bands offer a clear window into overbought conditions, helping traders make informed decisions. By combining these bands with volume analysis and other indicators, one can better predict market movements and avoid potential pitfalls. Remember, while Bollinger Bands are useful, they’re most effective when used with a broader strategy. Always stay informed and consult financial experts for the best results.
