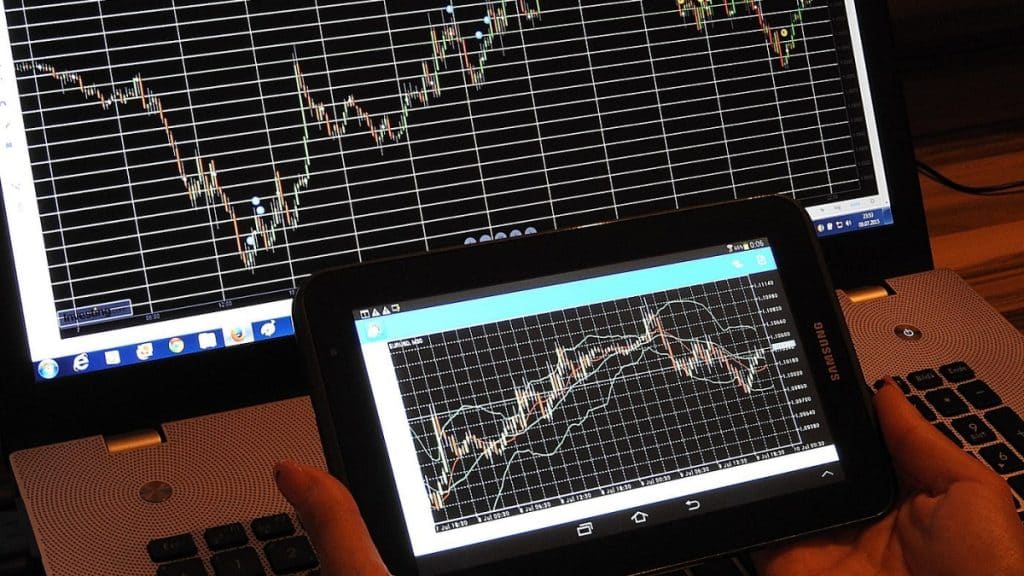
Understanding and using market indicators can feel like deciphering a foreign language. But these tools can help you make better investment decisions. Here’s a straightforward guide to help you grasp the essentials and apply them effectively. So, if you are starting to invest in digital assets like crypto, you may visit this source for more information.
What Are Market Indicators?
Market indicators are data points or metrics used to gauge the overall health and direction of financial markets. Think of them as weather forecasts for the economy. They provide insights into whether the market is likely to go up, down, or stay stable.
There are different types of market indicators. Leading indicators predict future movements. Lagging indicators confirm trends. Coincident indicators move with the economy. Each type serves a unique purpose, and understanding them can give you a better grasp of market dynamics.
Leading Indicators: Predicting Future Trends
Leading indicators help predict future market movements. They act like a crystal ball, giving you a glimpse into where the economy might be heading. Examples include the stock market itself, new orders for durable goods, and building permits.
The stock market is a well-known leading indicator. It often rises before the economy improves and falls before a recession. If you see a consistent upward trend in stock prices, it might signal economic growth ahead. On the other hand, a downward trend could indicate a slowdown.
Another example is the yield curve. This plots the interest rates of bonds with different maturities. An inverted yield curve, where short-term rates are higher than long-term rates, can signal a recession. Keeping an eye on these indicators can help you anticipate market shifts.
Lagging Indicators: Confirming Trends
Lagging indicators confirm what has already happened. They’re like looking in the rearview mirror. They help you understand the overall trend but don’t predict future movements. Common lagging indicators include unemployment rates, corporate profits, and interest rates.
Unemployment rates are a prime example. When unemployment is low, it usually means the economy has been doing well. High unemployment often follows economic downturns. By tracking these rates, you can confirm whether the economy has been expanding or contracting.
Corporate profits are another lagging indicator. High profits typically follow periods of economic growth. If you see companies reporting strong earnings, it’s a good sign the economy has been healthy. Conversely, declining profits can confirm an economic slowdown.
Coincident Indicators: Measuring Current Conditions
Coincident indicators move with the economy. They provide a snapshot of current economic conditions. Think of them as taking the economy’s pulse. Examples include GDP, industrial production, and retail sales.
Gross Domestic Product (GDP), measures the comprehensive value of goods and services produced. When GDP is rising, it indicates economic growth. A declining GDP suggests contraction. Keeping an eye on GDP helps you understand the current state of the economy.
Industrial production clearly measures the products of factories, mines, & utilities. When production is high, it signals strong economic activity. A drop in production can indicate a slowdown. This indicator helps you gauge the health of the manufacturing sector.
Retail sales track consumer spending. High retail sales suggest consumers are confident and willing to spend money. Low sales might signal economic trouble. Monitoring retail sales can give you a sense of consumer sentiment and economic health.
How to Use Market Indicators
Using market indicators effectively requires a mix of knowledge and intuition. Start by familiarizing yourself with the key indicators and what they represent. Then, observe how they interact and influence each other.
One approach is to combine different types of indicators. For example, use leading indicators to anticipate future trends, lagging indicators to confirm those trends, and coincident indicators to understand the current state. This comprehensive view helps you make more informed decisions.
It’s also essential to stay updated. Market conditions can change rapidly. Regularly review the latest data and reports. This helps you adapt to new information and adjust your strategy as needed.
Remember, no indicator is foolproof. Each has its strengths and weaknesses. Relying on a single indicator can lead to misleading conclusions. Instead, use a combination of indicators to get a balanced view.
Conclusion
Finally, seek professional advice. Financial advisors can provide valuable insights and help you interpret indicators correctly. They can also offer personalized strategies based on your unique goals and risk tolerance. Investing is complex, and having an expert in your corner can make a big difference. Understanding and using market indicators is like learning a new skill. It takes time and practice, but the rewards can be substantial.
