

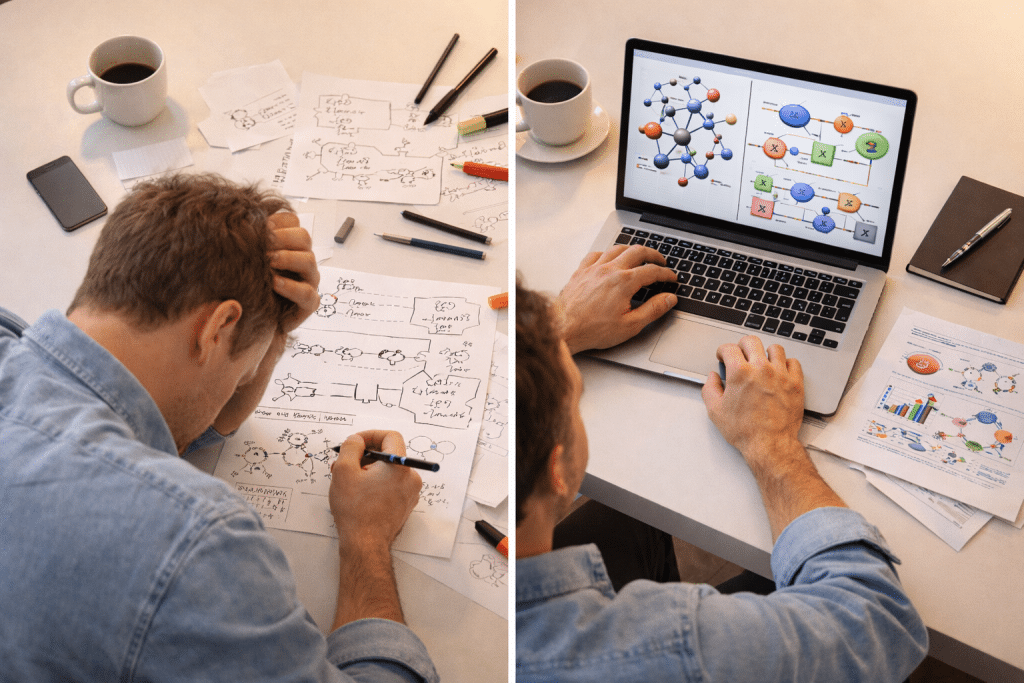
Academic publishing has always demanded more than strong research. The visual presentation of ideas — methodology diagrams, statistical plots, system architectures — plays a critical role in how reviewers and readers understand your work. Yet for most researchers, creating these figures remains one of the most time-consuming and frustrating parts of the publication process.
That frustration is now driving a quiet revolution. AI-powered figure generation tools are changing how researchers produce visual content for their papers, and the implications extend far beyond saving time.
The Hidden Bottleneck in Research Publishing
Ask any graduate student or postdoc about their publication workflow, and figure creation almost always comes up as a pain point. A single methodology diagram for a machine learning paper can take anywhere from 3 to 8 hours to produce using traditional tools like Adobe Illustrator, TikZ, or PowerPoint. Statistical plots require careful coding in Matplotlib or R, followed by extensive formatting to meet venue-specific style guidelines.
The problem is not just time. It is skill mismatch. Researchers are trained to design experiments and analyze data — not to be graphic designers. Many brilliant papers end up with mediocre figures simply because the authors lacked the visual design skills or the hours needed to produce something polished.
This bottleneck creates real consequences. Poorly designed figures can lead to misunderstandings during peer review. Inconsistent visual quality across a paper can undermine the perceived rigor of the research. And time spent wrestling with Illustrator is time not spent on actual science.
How AI Figure Generators Work
AI academic figure generators take a fundamentally different approach from traditional design tools. Instead of requiring users to manually place shapes, draw arrows, and adjust spacing pixel by pixel, these tools accept natural language descriptions and structured data as input, then produce publication-ready visuals automatically.
The underlying technology typically combines large language models with image generation capabilities. More advanced systems use multi-agent architectures — multiple specialized AI models working in sequence, each handling a different aspect of the figure creation process such as layout planning, style selection, and quality review.
For example, Paper Banana (paperbanana.run) employs a 5-agent pipeline where separate AI agents handle reference retrieval, structural planning, styling, visualization, and critical review. This approach mirrors how a human design team might operate, with each specialist focusing on their area of expertise.
The key advantage is that researchers can describe what they need in plain language — “a flowchart showing our three-stage training pipeline with data augmentation feeding into the encoder” — and receive a formatted diagram that follows academic conventions. For statistical plots, users can paste data in JSON format and specify the chart type, eliminating the need for custom plotting code.
What Makes Academic Figures Different from Regular Graphics
Academic figure generation is not the same as general-purpose image creation. The requirements are far more specific and demanding.
First, accuracy is non-negotiable. A methodology diagram must faithfully represent the system described in the paper. Any discrepancy between the figure and the text will be caught by reviewers and could result in rejection. This is why the most effective AI tools include verification steps — comparing generated figures against source text to check for faithfulness.
Second, style conventions vary significantly across venues. A figure suitable for a NeurIPS submission looks quite different from one targeting Nature or IEEE Transactions. Color palettes, typography, line weights, and layout density all follow unwritten but well-understood norms within each community. AI tools that have been trained on papers from these venues can automatically apply the appropriate visual language.
Third, statistical plots must be numerically precise. This is an area where pure image generation models can fail, as they may produce charts with incorrect proportions or fabricated data points. The most reliable approach is to generate executable code — Python Matplotlib scripts, for instance — rather than rendering plots directly as images. This ensures every bar height and axis label corresponds exactly to the underlying data.
Practical Impact on Research Workflows
Researchers who have adopted AI figure tools report significant changes in their workflow. The most obvious benefit is speed — what previously took hours now takes minutes. But the more interesting effects are behavioral.
When figure creation becomes fast and low-cost, researchers iterate more. They experiment with different visual representations of the same concept, trying multiple layouts before settling on the most effective one. This exploratory approach often leads to better figures than the “one and done” method forced by time constraints.
The accessibility benefits are also substantial. Non-native English speakers, who may already face challenges in academic writing, often struggle even more with visual design tools that have English-only interfaces and Western-centric design conventions. AI figure generators that accept plain-language descriptions lower this barrier considerably.
Early-career researchers benefit the most. Senior professors often have lab members or professional illustrators to handle figure creation. Graduate students working independently do not have this luxury. AI tools democratize access to publication-quality visuals. If you want to see the difference firsthand, try PaperBanana (paperbanana.run) and generate your first figure in under a minute.
Limitations and Honest Expectations
It is important to set realistic expectations. AI figure generators are not perfect, and treating them as fully autonomous design systems will lead to disappointment.
Complex multi-panel figures with intricate spatial relationships still require human oversight and often manual adjustment. The AI may misinterpret ambiguous descriptions or make layout choices that do not match the author’s intent. Iterative refinement — providing feedback and regenerating — is typically necessary to reach the desired result.
Additionally, these tools work best for common figure types: flowcharts, block diagrams, bar charts, line plots, and architecture diagrams. Highly specialized visualizations — molecular structures, geographic maps, circuit diagrams — may still require domain-specific software.
The best approach is to view AI figure generators as powerful first-draft tools. They eliminate the blank-canvas problem and produce a solid starting point that can be refined, rather than requiring you to build everything from scratch.
Looking Ahead
The trajectory is clear. As AI models become more capable and training datasets expand to cover more venues and figure types, the quality gap between AI-generated and manually crafted figures will continue to narrow.
We are likely to see deeper integration with academic writing platforms — imagine a LaTeX editor that automatically generates figures as you write your methodology section. Real-time collaboration features, where multiple authors can provide input and see the figure evolve, are also on the horizon.
For researchers, the practical advice is straightforward: start experimenting with these tools now. The learning curve is minimal, and the time savings are immediate. Whether you are a PhD student preparing your first submission or a professor managing multiple papers, AI figure generation is becoming an essential part of the modern research toolkit. Ready to get started? Use PaperBanana to create a scientific diagram (paperbanana.run) and see how it fits into your workflow.
Author Bio: Ethan is the founder of Paper Banana (paperbanana.run), an AI-powered academic figure generator used by researchers at institutions including Stanford, MIT, and Max Planck Institute. With a background in product development and AI applications, he is focused on building tools that help researchers communicate their work more effectively.